Historical Values
-
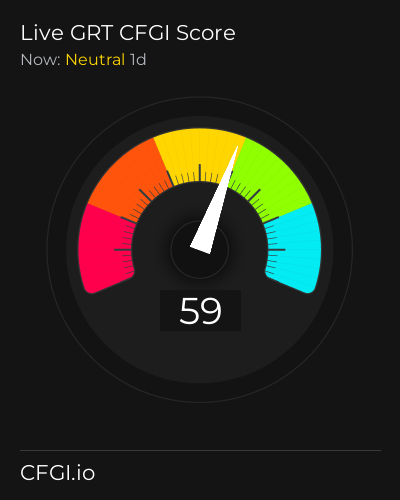
Now
Neutral 43 -
Yesterday
Neutral 43 -
7 Days Ago
Neutral 43 -
1 Month Ago
Neutral 43
The Graph Breakdown
Price Score Neutral
The Price Score indicator is a relevant indicator to analyze and assign the The Graph price evolution a certain numerical value.
This module studies the price trend to determine if the The Graph market has a bearish or bullish trend.
The main trend defines one part of the general sentiment of the market, and is a factor of weight when analyzing a chart. A pronounced and long-lasting positive trend generates a greater feeling of greed. In the same way, when the trend is negative, a greater feeling of fear is generated, regardless of other factors.
Volatility Fear
Price Volatility is also another important indicator and the biggest trigger for market sentiment. To measure it, we use values between 0 and 1 that determine the degree of current The Graph price fluctuation for the desired time frame.
Higher volatility implies a riskier market, which further polarizes bullish and bearish sentiments. An increase in volatility implies greater greed in a bull market, but also greater fear in a bear market.
Volume Fear
Like volatility, the The Graph Volume is a determining factor.
An increase in the volume implies a greater negotiation in the market, which is caused by an increase in the movements caused by an interest, which is synonymous with great sentiment. A strong volume determines a strong level of greed in The Graph bull markets, but also a strong level of panic in bear markets.
Like volatility, it is also calculated with a range between 0 and 1.
Impulse Neutral
The Impulse indicator measures the current The Graph price strength compared to previous values to determine in a range from -1 to 1 how it is affecting the The Graph market sentiment.
Impulse has a huge impact on sentiment, as on a psychological level we tend to place more importance on the latest price move.
The strength of this shows price inclination that can be more or less pronounced and determines the polarity. A strong bullish impulse in a market implies a greater feeling of greed, in the same way that a strong bearish impulse generates a greater feeling of fear or panic.
Technical Fear
It is proven that technical analyzes themselves influence market sentiment, especially those that are more popular.
The technical analysis indicator analyzes for The Graph the 26 most popular stock market indicators and subdivides them into 2 main categories that differentiate them in their type of trend indicator or oscillator. Subsequently, each one of them is averaged and assigned a certain weight based on the popularity of each one. These results fairly accurately reflect the impact generated by these charts on market analysts.
Social Fear
Dominance Extreme Greed
This other indicator takes into account the dominance of The Graph with respect to the general market. When it gets greedy, altcoin investments greatly increase and the total market capitalization increases, which also decreases The Graph's dominance. The same thing happens when the market panics but in reverse. For this reason, both the token capitalization and the total market capitalization are calculated.
But there is also a correlation between the dominance of The Graph and the dominance of the main altcoins, so the indicator calculates different values for each cryptocurrency.
Search Fear
Trends is another factor that determines the sentiment of a particular market. We analyze the search volume on The Graph has on major search engines on Google.
The lookup indicator looks at the current value and compares it to previous values to determine what particular interest there is in The Graph. For this, specific search terms are used that determine the purchasing or ceding interest of The Graph, thus excluding general terms that only define popularity without demonstrating negativity or possibility.
Whales Neutral
One of the analyzes that can determine the cryptocurrency market is the movement of whales.
CFGI analyzes the movements of superlative amounts made by large investors in two ways, first it analyzes large movements from wallets to exchanges of The Graph and compares them with the large movements of stable coins that are also made from wallets to exchanges to estimate the proportion of purchase and sale to be made.
A high ratio of The Graph moves to stablecoins indicates strong selling intent which means greed market, while a higher ratio of stablecoins moves indicates stronger buying intent and fear market.
Order Book Neutral
Another great predictor of sentiment through a quantitative source are the order books. Crypto Fear and Greed Index analyzes the order book for The Graph on a popular exchange to determine the buying and selling pressure that contiguous orders exert on the price. In such a way that you can know the buying and selling pressure that the orders which are going to be executed will exert.
Stronger buying pressure than selling pressure close to price is a clear indication of bearish sentiment, as there are more buy orders within equal distance to the price. While stronger selling pressure above price indicates a bullish sentiment, because there are more sells to execute than buys at the same distance.
The Graph News


![Will The Graph [GRT] see a 15% rally soon? Assessing the odds](https://crypto.snapi.dev/images/v1/8/q/4/chandan-31-11zon-634243.jpg)
The Graph (GRT) Price Prediction for 2025 – 2030: Future Growth Potential

Sentiment: Positive
Read more

The Graph Price Prediction 2024, 2025 – 2030: Will GRT Price Rally To $1?

Sentiment: Positive
Read more
RUNE, GRT, and T drop alongside Bitcoin as market sentiment turns bearish

Sentiment: Negative
Read more


AI-Tokens Face Huge Rejection: Here's What's Next for NEAR, RENDER, INJ, AKT & GRT Prices

Sentiment: Negative
Read more
A New Crypto Underdog Beating the Big Boys Fantom (FTM) and the Graph (GRT) With Over 100% Growth

Sentiment: Positive
Read more
Bitcoin price advance toward $68K sets a bullish path for SOL, ICP, GRT and BONK

Sentiment: Positive
Read moreThe Graph (GRT) Price Recovery at Risk: What Investors Need to Know About Rising Selling Pressure

Sentiment: Negative
Read more


Price Prediction: How Will The Graph's (GRT) Price Perform from 2024 to 2030

Sentiment: Neutral
Read more
AI Tokens Dominance Surge! Will RNDR, GRT, And FET Lead The Upcoming Bull Rally?

Sentiment: Positive
Read more
Latest news and price analysis of the crypto The Graph (GRT), Litecoin (LTC) and Bonk (BONK)

Sentiment: Neutral
Read more


Crypto Market Watch: GRT, TON, and WIF Outperform Leading Cryptocurrencies As Market Rises Over $50 Billion

Sentiment: Positive
Read moreAkash Network (AKT) And The Graph (GRT) Surge As AI Tokens Rebound! What's Next?

Sentiment: Positive
Read moreNews and price analysis of the crypto The Graph (GRT) and Shiba Inu (SHIB)

Sentiment: Neutral
Read more
Top Cryptos to Watch After Bitcoin Breaks $70000: BTC- DOGE- GRT Predictions

Sentiment: Positive
Read moreTop Crypto Coins To Focus If Bitcoin Breaks $70000; BTC, DOGE, GRT Price Prediction

Sentiment: Positive
Read more


Top AI Tokens GRT, NEAR, AGIX Drive AI Sector Rally Amid OpenAI Sora Hype

Sentiment: Positive
Read moreCrypto Market Analysis For February 18th: BTC Hints Local Top At $52K, ADA and GRT Jump +5%

Sentiment: Negative
Read more
Prices and news of crypto Icon (ICX), The Graph (GRT), and Polkadot (DOT)

Sentiment: Neutral
Read more


The Graph (GRT) Price Prediction 2023, 2024, 2025: Will GRT Prices Ride The Hopium Rally To $1?

Sentiment: Positive
Read more
The Graph (GRT) Unveiled: A Beacon in Crypto Winter with Potential for Multi-Generational Impact

Sentiment: Positive
Read more


The Graph Major Announcement Today: GRT Whales Sell on High Impact News Fueling Further Price Correction

Sentiment: Negative
Read moreNew Biden Rule Could Affect AI Cryptocurrencies Like GRT, AGIX, FET (Opinion)
Sentiment: Negative
Read more


News and price analysis of the cryptos Solana (SOL), Polygon (MATIC) and The Graph (GRT)

Sentiment: Positive
Read moreNews and prices of crypto assets The Graph (GRT), Cronos (CRO) and Casper (CSPR)

Sentiment: Neutral
Read moreThe Graph $GRT Enters Phase 3 of Scaling on L2, Introducing New Transfer Tools

Sentiment: Positive
Read moreThe Graph Price Analysis: Here's Why GRT Price Has 2x Potential Despite A Supreme Trendline Breakdown!

Sentiment: Negative
Read moreThe Graph (GRT) Price Prediction 2022, 2023, 2024, 2025: Will Substreams Fuel GRT Prices On A Hopium Rally To $1?

Sentiment: Positive
Read moreThe Graph (GRT): Enabling the Future of Decentralized Data Indexing and Querying

Sentiment: Positive
Read moreThe Graph Price Analysis: Here's Why GRT Price Can Crash Under $0.10; Is It A Perfect Chance To Sell?

Sentiment: Negative
Read moreGRT Price Analysis: Closer To Tip, Will GRT Price Break The Triangle To Aim $0.20
Sentiment: Neutral
Read moreNews and price analysis for the crypto assets The Graph (GRT) Arbitrum (ARB) and Monero (XMR)

Sentiment: Positive
Read moreBitcoin Stuck Below $31K, While FIL and GRT Skyrocket by Double Digits (Market Watch)

Sentiment: Neutral
Read moreThe Graph Price Prediction 2023, 2024, 2025: Will GRT Price Explode This Year?

Sentiment: Positive
Read moreCompound, Filecoin, Litecoin, GRT prices to soar if BTC soars past $31,480

Sentiment: Positive
Read more
The Graph News
The Graph (GRT) Price Prediction for 2025 – 2030: Future Growth Potential
Sentiment: Positive
Read moreThe Graph Price Prediction 2024, 2025 – 2030: Will GRT Price Rally To $1?
Sentiment: Positive
Read moreRUNE, GRT, and T drop alongside Bitcoin as market sentiment turns bearish
Sentiment: Negative
Read moreAI-Tokens Face Huge Rejection: Here's What's Next for NEAR, RENDER, INJ, AKT & GRT Prices
Sentiment: Negative
Read moreA New Crypto Underdog Beating the Big Boys Fantom (FTM) and the Graph (GRT) With Over 100% Growth
Sentiment: Positive
Read moreBitcoin price advance toward $68K sets a bullish path for SOL, ICP, GRT and BONK
Sentiment: Positive
Read moreThe Graph (GRT) Price Recovery at Risk: What Investors Need to Know About Rising Selling Pressure
Sentiment: Negative
Read morePrice Prediction: How Will The Graph's (GRT) Price Perform from 2024 to 2030
Sentiment: Neutral
Read moreAI Tokens Dominance Surge! Will RNDR, GRT, And FET Lead The Upcoming Bull Rally?
Sentiment: Positive
Read moreLatest news and price analysis of the crypto The Graph (GRT), Litecoin (LTC) and Bonk (BONK)
Sentiment: Neutral
Read moreCrypto Market Watch: GRT, TON, and WIF Outperform Leading Cryptocurrencies As Market Rises Over $50 Billion
Sentiment: Positive
Read moreAkash Network (AKT) And The Graph (GRT) Surge As AI Tokens Rebound! What's Next?
Sentiment: Positive
Read moreNews and price analysis of the crypto The Graph (GRT) and Shiba Inu (SHIB)
Sentiment: Neutral
Read moreTop Cryptos to Watch After Bitcoin Breaks $70000: BTC- DOGE- GRT Predictions
Sentiment: Positive
Read moreTop Crypto Coins To Focus If Bitcoin Breaks $70000; BTC, DOGE, GRT Price Prediction
Sentiment: Positive
Read moreTop AI Tokens GRT, NEAR, AGIX Drive AI Sector Rally Amid OpenAI Sora Hype
Sentiment: Positive
Read moreCrypto Market Analysis For February 18th: BTC Hints Local Top At $52K, ADA and GRT Jump +5%
Sentiment: Negative
Read morePrices and news of crypto Icon (ICX), The Graph (GRT), and Polkadot (DOT)
Sentiment: Neutral
Read moreThe Graph (GRT) Price Prediction 2023, 2024, 2025: Will GRT Prices Ride The Hopium Rally To $1?
Sentiment: Positive
Read moreThe Graph (GRT) Unveiled: A Beacon in Crypto Winter with Potential for Multi-Generational Impact
Sentiment: Positive
Read moreThe Graph Major Announcement Today: GRT Whales Sell on High Impact News Fueling Further Price Correction
Sentiment: Negative
Read moreNew Biden Rule Could Affect AI Cryptocurrencies Like GRT, AGIX, FET (Opinion)
Sentiment: Negative
Read moreNews and price analysis of the cryptos Solana (SOL), Polygon (MATIC) and The Graph (GRT)
Sentiment: Positive
Read moreNews and prices of crypto assets The Graph (GRT), Cronos (CRO) and Casper (CSPR)
Sentiment: Neutral
Read moreThe Graph $GRT Enters Phase 3 of Scaling on L2, Introducing New Transfer Tools
Sentiment: Positive
Read moreThe Graph Price Analysis: Here's Why GRT Price Has 2x Potential Despite A Supreme Trendline Breakdown!
Sentiment: Negative
Read moreThe Graph (GRT) Price Prediction 2022, 2023, 2024, 2025: Will Substreams Fuel GRT Prices On A Hopium Rally To $1?
Sentiment: Positive
Read moreThe Graph (GRT): Enabling the Future of Decentralized Data Indexing and Querying
Sentiment: Positive
Read moreThe Graph Price Analysis: Here's Why GRT Price Can Crash Under $0.10; Is It A Perfect Chance To Sell?
Sentiment: Negative
Read moreGRT Price Analysis: Closer To Tip, Will GRT Price Break The Triangle To Aim $0.20
Sentiment: Neutral
Read moreNews and price analysis for the crypto assets The Graph (GRT) Arbitrum (ARB) and Monero (XMR)
Sentiment: Positive
Read moreBitcoin Stuck Below $31K, While FIL and GRT Skyrocket by Double Digits (Market Watch)
Sentiment: Neutral
Read moreThe Graph Price Prediction 2023, 2024, 2025: Will GRT Price Explode This Year?
Sentiment: Positive
Read moreCompound, Filecoin, Litecoin, GRT prices to soar if BTC soars past $31,480
Sentiment: Positive
Read moreHistorical Values
-
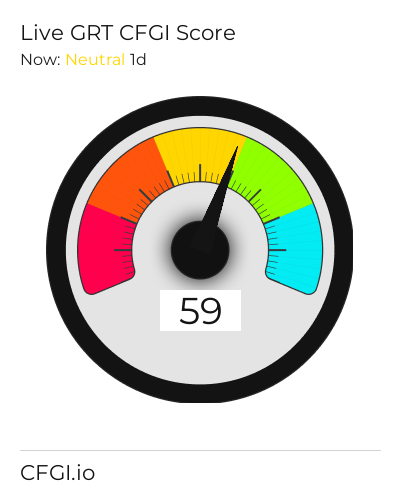
Now
Neutral 43 -
Yesterday
Neutral 44 -
7 Days Ago
Neutral 47 -
1 Month Ago
Neutral 56
The Graph Breakdown
Price Score Neutral
The Price Score indicator is a relevant indicator to analyze and assign the The Graph price evolution a certain numerical value.
This module studies the price trend to determine if the The Graph market has a bearish or bullish trend.
The main trend defines one part of the general sentiment of the market, and is a factor of weight when analyzing a chart. A pronounced and long-lasting positive trend generates a greater feeling of greed. In the same way, when the trend is negative, a greater feeling of fear is generated, regardless of other factors.
Volatility Fear
Price Volatility is also another important indicator and the biggest trigger for market sentiment. To measure it, we use values between 0 and 1 that determine the degree of current The Graph price fluctuation for the desired time frame.
Higher volatility implies a riskier market, which further polarizes bullish and bearish sentiments. An increase in volatility implies greater greed in a bull market, but also greater fear in a bear market.
Volume Fear
Like volatility, the The Graph Volume is a determining factor.
An increase in the volume implies a greater negotiation in the market, which is caused by an increase in the movements caused by an interest, which is synonymous with great sentiment. A strong volume determines a strong level of greed in The Graph bull markets, but also a strong level of panic in bear markets.
Like volatility, it is also calculated with a range between 0 and 1.
Impulse Neutral
The Impulse indicator measures the current The Graph price strength compared to previous values to determine in a range from -1 to 1 how it is affecting the The Graph market sentiment.
Impulse has a huge impact on sentiment, as on a psychological level we tend to place more importance on the latest price move.
The strength of this shows price inclination that can be more or less pronounced and determines the polarity. A strong bullish impulse in a market implies a greater feeling of greed, in the same way that a strong bearish impulse generates a greater feeling of fear or panic.
Technical Fear
It is proven that technical analyzes themselves influence market sentiment, especially those that are more popular.
The technical analysis indicator analyzes for The Graph the 26 most popular stock market indicators and subdivides them into 2 main categories that differentiate them in their type of trend indicator or oscillator. Subsequently, each one of them is averaged and assigned a certain weight based on the popularity of each one. These results fairly accurately reflect the impact generated by these charts on market analysts.
Social Fear
Dominance Extreme Greed
This other indicator takes into account the dominance of The Graph with respect to the general market. When it gets greedy, altcoin investments greatly increase and the total market capitalization increases, which also decreases The Graph's dominance. The same thing happens when the market panics but in reverse. For this reason, both the token capitalization and the total market capitalization are calculated.
But there is also a correlation between the dominance of The Graph and the dominance of the main altcoins, so the indicator calculates different values for each cryptocurrency.
Search Fear
Trends is another factor that determines the sentiment of a particular market. We analyze the search volume on The Graph has on major search engines on Google.
The lookup indicator looks at the current value and compares it to previous values to determine what particular interest there is in The Graph. For this, specific search terms are used that determine the purchasing or ceding interest of The Graph, thus excluding general terms that only define popularity without demonstrating negativity or possibility.
Whales Neutral
One of the analyzes that can determine the cryptocurrency market is the movement of whales.
CFGI analyzes the movements of superlative amounts made by large investors in two ways, first it analyzes large movements from wallets to exchanges of The Graph and compares them with the large movements of stable coins that are also made from wallets to exchanges to estimate the proportion of purchase and sale to be made.
A high ratio of The Graph moves to stablecoins indicates strong selling intent which means greed market, while a higher ratio of stablecoins moves indicates stronger buying intent and fear market.
Order Book Neutral
Another great predictor of sentiment through a quantitative source are the order books. Crypto Fear and Greed Index analyzes the order book for The Graph on a popular exchange to determine the buying and selling pressure that contiguous orders exert on the price. In such a way that you can know the buying and selling pressure that the orders which are going to be executed will exert.
Stronger buying pressure than selling pressure close to price is a clear indication of bearish sentiment, as there are more buy orders within equal distance to the price. While stronger selling pressure above price indicates a bullish sentiment, because there are more sells to execute than buys at the same distance.